Most growing startups track monthly deal count or total revenue, but that top line hides where growth is really won or lost. These are the five RevOps reports I look at daily when managing growth and revenue functions, and what each one reveals about how marketing and sales perform together.

If you run a SaaS or sales led growth organisation, you probably already have a top level report showing monthly deal count or total revenue. To monitor what sits beneath that top line, I have picked the top five reports I look at daily when managing growth and revenue functions: marketing source by lifecycle stage, deal stage conversion rate, sales activity and response time, pipeline by close date and sales rep, and lead and deal status reasons. Together they show how marketing and sales perform as one revenue engine, not two separate teams, and consistently reveal whether both are heading in the right direction.
Gone are the days of spending hours analysing raw data. With the AI functionality now built into most CRMs, you can create a report or run a one off analysis with a simple prompt.
Shows where leads come from and how far each channel's leads progress. It is the clearest gauge of whether your marketing investment is working.
Depending on what you value as a business, use UTM tracking or a first touch "how did you hear about us" question to capture marketing source.
Break it down by lifecycle stage: subscriber, lead, MQL, SQL and customer, and view it monthly to see the trend. Similarly, a marketing source by deal stage or revenue generated report shows which channels lead to closed won or lost deals, along with the ROI on your marketing spend. A high volume channel that rarely produces SQLs or closed won deals tells a very different story to a smaller one that delivers quality, and that difference tells you where to put your budget.
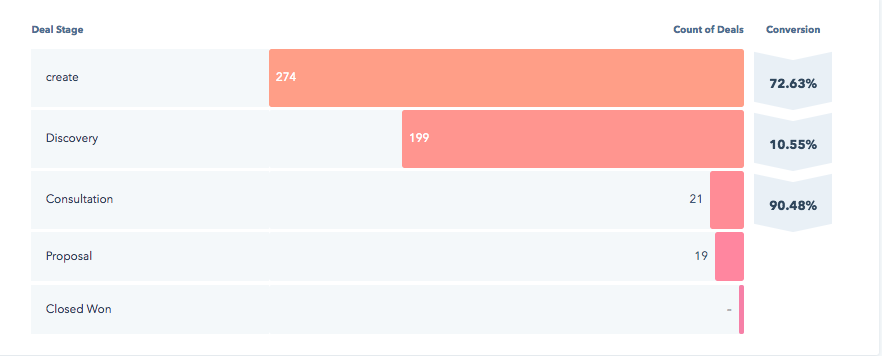
Shows the conversion rate between each pipeline stage. The biggest drop is your biggest leak.
If deals move smoothly to proposal but rarely close, the problem is likely pricing, proposal quality or follow up, not lead volume, despite what sales teams often like to say. There is no point pouring more into a leaky bucket, so fix the leak before, or while, marketing brings new leads into the pipeline. I keep one view for the team overall and one for each sales rep, so each rep's numbers can be compared against the team average and coached accordingly. It shows exactly where to focus and which levers to pull, whether that is offers, tools or skills.
If you have an outbound sales function, call volume per salesperson broken down by outcome is a must: connected, voicemail, meeting booked or not interested.
For inbound sales teams, a response time report shows how quickly new enquiries get a first reply. A 2026 benchmark of 939 B2B companies found leads contacted within five minutes closed at 32%, compared with 12% for those contacted after 24 hours. Speed matters when buyers are presented with ever more choices at once, and both reports give junior teams clear standards to work towards.
This one is obvious but crucial. It shows each salesperson's open pipeline by expected close month, so you know whether hitting target is realistic while there is still time to act.
It turns forecasting from gut feel into a simple comparison, and quickly surfaces deals on past close dates or reps with thin pipeline.
Shows why leads are rejected by sales and why deals are lost. Sales typically capture this through a dropdown field, and while it can be charted many ways, the view I use most is a monthly bar graph broken down by reason, showing the trend and the mix at the same time. It points you to the factors worth fixing, the ones that stop leads and deals from converting.
Rejection reasons such as wrong fit or no budget tell marketing whether targeting is working. Lost reasons such as price, timing or a competitor show sales where the process needs work. A simple incentive keeps this data clean: I use the rejection reasons to filter subquality leads out of individual sales performance reports, so they do not drag down a rep's numbers, which gives sales every reason to keep this field up to date.

These are not the only reports worth building, but they give the clearest picture of how marketing and sales perform together, making them the right place to start monitoring performance before you build anything new.
For teams with junior hires, these five reports provide the structure that is often missing: shared targets, clear standards and an honest view of where revenue leaks. No full time CRO required, just the discipline to review them and act.
Main image by Lukas Blazek on Unsplash

Nina Jung is a Sydney-based growth strategist who works with founders as a fractional CMO and CRO, bringing senior-level strategy and hands-on execution at a fraction of the cost of a full-time hire. She also mentors early-stage founders and business students through GrowthMentor, Startmate, and UNSW.
